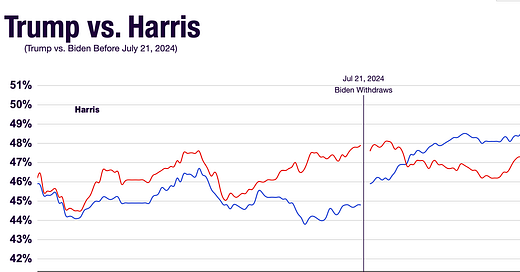
The Polling On The Election Is Garbage -- The Press Calling The Race A "Toss-Up" Is Meant To Keep Democrats From Being Demoralized
How badly the polls missed the actual voting in 2016 and 2020 tells you all you need to know about why 2024 isn't close at all.
It’s all crap. Nothing in the recent history of polling suggests that the numbers above are correct. In fact, just the opposite is almost certainly true.
First, as most pollsters and pundits will concede, the “national” race is irrelevant because Presidents are not elected by national referendum. In 2020, Joe Biden won California and New York by a combined total of 7.1 million votes out of 155 million votes cast nationwide. His margin of victory was 7 million votes. So the rest of the country was split about evenly.
Harris will likely run up vote margins in California and New York by a similar combined total. If the national number is what the polls are claiming, then the state-by-state polling in the other 48 states should be in the ballpark of what the state-by-state polling was in those states is 2020. But, as is shown below, Biden’s poll numbers were significantly better vs. Trump in early-to-mid Oct. 2020 as compared to Harris’ poll numbers now. Yet, when election day came in Nov. 2020, the polls showing significant Biden leads in the battleground states turned out to be wrong — all in one same direction. Biden enjoyed significant polling advantages in every state, and underperformed those poll numbers on election day in every state — some by very wide margins.
The same thing happened in 2016 with Clinton.
So, when the media tells you now that the polling shows tight races or dead heats in the battleground states for 2024, keep in mind that nearly ALL the state level polling in 2016 and 2020 were off significantly, and the error was almost universally in over-estimating the vote that Clinton and Biden would receive, AND underestimating the vote that Trump would receive.
But let’s begin with some media “mea culpas” following the 2020 election — first from a Vanderbilt University Research News:
From FiveThirtyEight:
From the Wall Street Journal:
So who is prepared to take the media and their pollsters at their word that they have identified and solved their polling problems from multiple prior election cycles, and the numbers they are putting out now are an accurate reflection of where the race between Trump and Harris stands? Yeah — not me either.
Why? Donald Trump is running in his third consecutive contest for President, and the pollsters and pundits botched the first two. Fool me once — shame on you. Fool me twice — shame on me. A third time?? I don’t think so.
In addition, there have been numerous poll-driven stories over the past several weeks dealing with some of the “internals” of polls being reported. Nearly every one shows Trump over-performing with some segment of the electorate as compared to the election RESULTS in 2016, but most especially 2020.
From 8 days ago, we have this report from NBC News about polling support continuing to increase for Trump from Hispanic voters:
This is not a “one-off” — the movement of Hispanic voters along with working-class white voters towards the GOP and Trump is a well-established trend over a few election cycles, and it has been reflected in election results.
Next we have “Independents” as reflected in a PBS News story from mid-September after the Trump v. Harris debate:
So Biden beats Trump with “independents” by 15 points in 2020, Harris now trails by 3 points with those same “independents” — but she leads the national race when “independents” are approaching 1/3 of the electorate??
Let’s just consider the “round number” math: If “independents” made up 1/3 of the 155 million votes in 2020, then that is 51-52 million votes. If Biden won them by a margin of 57.5 to 42.5, that is 7.6 million vote margin, with Biden having received somewhere around 29.4 million votes from independents.
If Harris is on track to receive 46%, that is only 23.6 million votes — a net loss of almost 6 million “independent” votes nationwide.
And last, what about younger voters — 18 to 29 — even after Harris replaced Biden:
So, on top of lagging behind Biden’s numbers with Hispanics and Independents in 2020, Harris also lags behind with younger voters — down to 50% from 60% — among the most crucial demographic group that Democrats rely on to win close elections.
Finally, lets take a close look at the history of battleground state polling from 2016 and 2020. I used FiveThirtyEight’s collection of state polling for those two races, focused on polls taken in those two years from the last week of September to the middle of October — not quite the “final stretch” of the campaign. Each of the seven battleground states is set forth separately for 2016, 2020, and the most recent polling for 2024. The most recent poll numbers are farthest to the left.
Arizona 2016
For Clinton: +1, +2
For Trump: +1, +3, +2, +8, +4, +5
Polling Advantage Trump: 2.2
Result: TRUMP +3.5
Arizona 2020
For Biden: +8, +2, +3, +2, +5, +3, +6, +2, +3, +1, +6
For Trump: +1, +4
Polling Advantage BIDEN: 2.6
Result: BIDEN +0.3
Arizona 2024
For Harris: +2, +3, +3, +2,
For Trump: +1, +4, +1, +3, +2, +6
Georgia 2016
For Clinton: No polls had Clinton leading after Aug.
For Trump: +3, +5, +6, +9, +7, +11
Polling Advantage Trump: 4.0
Result: TRUMP +5
Georgia 2020
For Biden: +4, +7, +2, +7, +1,
For Trump: +2, +1,
A few polls in early Oct. had it even.
Polling Advantage BIDEN: 1.2
Result: BIDEN + 0.2
Georgia 2024
Georgia for Harris: +1, +3, +1. +2
Georgia for Trump: +5, +1, +2, +2, +1
4 polls have had it Even since mid-Sept.
Michigan 2016
For Clinton: +8, +9, +4, +4, +5, +7
For Trump +1, +1, +2.
Polling Advantage CLINTON: 4.2.
Result: TRUMP +0.5
Michigan 2020
For Biden: +8, +8, +10, +6, +7, +9, +8, +8, +6, +11
For Trump: +2, +4,
Polling Advantage BIDEN: 7.9
Result: BIDEN +2
Michigan 2024:
For Harris: +3, +1, +3, +3, +2, +1, +5, +2, +1, +8, +5, +5
For Trump: +1, +2, +3, +3
Trump leading in the most recent polls.
North Carolina 2016
For Clinton: +3, +2, +1, +2, +2
For Trump: +1, +1, +1
Multiple polls had it tied in early to mid. Oct.
Polling Advantage CLINTON: .7
Result: TRUMP +4
North Carolina 2020
For Biden: +3, +2, +5, +4, +1, +5, +4, +2, +5, +4, +7, +3,
No polls showed Trump leading
Polling Advantage BIDEN 1.8.
Result: TRUMP +1.3
North Carolina 2024
For Harris: +2
For Trump: +3, +1, +1, +4, +2
All polling from Sept.
Nevada 2016
For Clinton: +4, +4, +3, +2, +1, +1, +2,
For Trump: +2, +1, +2
Polling Advantage CLINTON: 1.2
Result: CLINTON +2.5
Nevada 2020
For Biden: +3, +2, +6, +6,
No polls showed Trump leading
Polling Advantage BIDEN 5.3
Result: BIDEN +2.3
Nevada 2024
For Harris: +1, +3, +7, +1, +3
For Trump: +1, +1, +1,
All polling from Sept.
Pennsylvania 2016
For Clinton: +7, +4, +8, +5, +2, +5, +4, +8,
For Trump: +1, +1, +2, +1
Polling Advantage CLINTON: 3.7
Result: TRUMP +0.5
Pennsylvania 2020
Pennsylvania for Biden: +8, +1, +3, +6, +7, +8, +5, +5, +7, +3, +13, +5, +4
No polls showed Trump leading
Polling Advantage BIDEN 4.7
Result: BIDEN +1.1
Pennsylvania 2024
Pennsylvania for Harris: +1, +5, +1, +3, +2, +3, +2, +5, +2
Pennsylvania for Trump: +1, +2, +3, +1
All polling from Sept.
Wisconsin 2016
For Clinton: +5, +3, +2, +3, +9, +4, +6
No polling showed Trump ahead.
Polling Advantage CLINTON: 5.3
Result: TRUMP +1
Wisconsin 2020
For Biden: +2, +13, +10, +10, +8, +7, +8, +10, +7, +5,
No polls showed Trump leading.
Polling Advantage BIDEN: 8.4
Result: BIDEN +0.7
Wisconsin 2024
For Harris: +4, +2, +2, +5, +3, +2, +1, +6, +1, +1
For Trump: +1, +2, +2,
In 2016 Trump won Wisconsin, Pennsylvania, Michigan, and North Carolina where polling had Clinton ahead — and significantly ahead in Wisconsin and Michigan particularly. Trump also over-performed his polling in Arizona and Georgia. That means in 6 of the 7 battleground states in 2016 Trump’s polling lagged behind his actual vote totals. Clinton underperformed in every battleground state except Nevada.
In 2020, Biden underperformed his polling In ALL SEVEN battleground states – massively so in Pennsylvania, Michigan and Wisconsin. He had clear polling edges in Georgia and Arizona and squeaked out each by less than 0.3%. North Carolina was just a polling gaslight party – Biden lead nearly every poll in early to mid Oct. and lost – with the polling being off over 3%. Biden won Nevada, but by less than one-half what the polling margin indicated.
There is no reason to believe — particularly with the overt media hostility and bias aimed at Trump — that the 2024 battleground state polls are any more reliable than the 2016 or 2020 state polls.
Trump is almost certain to win any state where he is currently leading in the polls.
Trump is likely to win any state where the race is said by the media anhd pollsters to be “too close to call.”
Trump has a chance to win any state where the polling for Harris has her with a less than 4% lead.
Only states where Harris is up 8+ points is she likely safe. Using those numbers, Harris has only the following states on her side of the ledger:
California (54), Colorado (10), Connecticut (7), Delaware (3), D.C.(3), Hawaii (4), Illinois (19), Maine (3), Maryland (10), Massachusetts (11), New Mexico (5), New York (28), Oregon (8), Rhode Island (4), Vermont (3), Virginia (13) and Washington (12) — 198 Electoral Votes
Leaning but not solid: Minnesota, New Jersey
States where Trump is leading or down by 3 or less:
Alabama (9), Alaska(3), Arizona (11), Arkansas (6), Florida (30), Georgia (16), Idaho (4), Indiana (11), Iowa (6), Kansas (6), Kentucky (8), Louisiana (8), Michigan (15), Mississippi (6), Missouri (10), Montana (4), Nebraska (4), Nevada (6), New Hampshire (4), North Carolina (16), North Dakota (3), Ohio (17), Oklahoma (6), Pennsylvania (19), South Carolina (9), South Dakota (3), Tennessee (11), Texas (40), Utah (6), West Virginia (4), Wisconsin (10), and Wyoming (3) — 344 Electoral Votes.
Even if Trump loses 2-3 of these states he’s still way above 270.
The media’s efforts to continue to cast the race as “too close to call” is intended to keep the Democrats in the down-ballot races — especially the Senate contests involving endangered Democrat incumbents. Trump in the White House with a small House Majority and 54+ seats in the Senate is the worst nightmare imaginable for progressives and their water-carriers in the media.
The numbers regarding Black, Hispanic, and younger voters indicate Trump should win, even must win, because no Democrat can win without over-whelming percentages of those groups. Trump is taking too many of those voters to make the Democrats' numbers work. BUT you have not figured in the cheating that will inevitably occur. I still currently think Trump's margins will be sufficient to overcome the cheating, but their will to cheat to win can't be underestimated. Plus who knows how many Trump voters in NC and SC will be disinfranchised by the hurricane and FEMA.
Hope you got it right.